WestJet Airlines profit history
First published on March 24, 2012
Amidst all of the reports of Air Canada‘s financial troubles and strikes, I was curious about the financial history of Canada’s other major airline, WestJet. I couldn’t find a simple chart on the history of WestJet’s profit / losses, either quarterly or yearly. Here’s a simple table and chart on WestJet’s annual net earnings history, taken from WestJet’s annual reports:
| Year | Net earnings (thousands of dollars) |
|---|---|
| 1997 | 6,200 |
| 1998 | 6,500 |
| 1999 | 15,800 |
| 1999 | 15,800 |
| 2000 | 30,300 |
| 2001 | 36,700 |
| 2002 | 51,780 |
| 2003 | 60,539 |
| 2004 | -17,168 |
| 2005 | 24,001 |
| 2006 | 116,631 |
| 2007 | 189,048 |
| 2008 | 178,506 |
| 2009 | 98,178 |
| 2010 | 90,197 |
| 2011 | 148,702 |
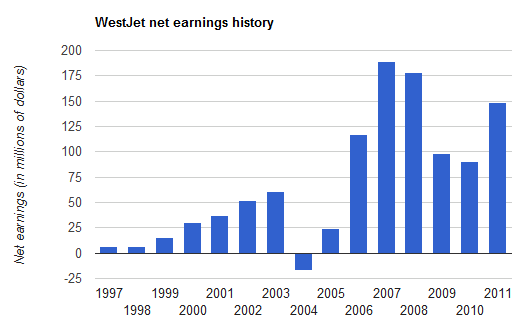
Note: earnings prior to 2010 are stated using Canadian GAAP. 2010 and later are stated using IFRS, which is now mandatory for publicly accountable companies in Canada.
Note: I do not own, nor do I plan to ever own, shares in WestJet, Air Canada, or any related company.
 Facebook
 Twitter
 Email this
 keung.biz. Hire my web consulting services at


March 25th, 2012 at 2:19 pm
Tim says:
I don’t know if it is the union is driving AC into the ground, but even comparing the Air Canada stock on the TSE against WJA does indicate public sentiment has been waning for quite some time. I’m curious if there are numbers on a route level, to be able to fairly compare AC ridership on the same routes as WJ. My guess is that WJ has an advantage in focusing on its more profitable routes.
Reply from Peter: I also read somewhere that WestJet’s break-even load factor is somewhere around 75% whereas Air Canada’s is around 85%